Results
For harvested subplots, average g/cm2 was used to create a conversion factor for lichen cover to biomass, which was applied at the plot level to get g/m2. This biomass per plot was scaled up to the transect level to get total biomass (in kg/ha) for each site. Total biomass was plotted by strata to observe trends in lichen biomass over time. Additionally, total biomass of peatland sites was plotted with upland jack pine sites to compare ecosite effects on lichen abundance.
In upland jack pine sites, Cladonia lichens were not observed 0-10 years post-fire. At 10-20 years post-fire, little lichen was present, with a mean biomass of 44.23 kg/ha. From 21-40 years post-fire, lichen abundance increased rapidly, with a mean biomass of 804.10 kg/ha. Biomass in mature upland forests did continue to increase, but at a declining rate (mean biomass of 932.25 kg/ha). The declining rate is likely due to an increase in other ground cover over time, such as bryophytes or vascular plants.
In contrast, peatlands showed low overall lichen abundance, with a mean biomass of 473.42 kg/ha. This low value may be associated with the variable water table in peatlands. In areas that are quite wet or have a high water table, lichen may not be able to establish and persist.
In contrast, peatlands showed low overall lichen abundance, with a mean biomass of 473.42 kg/ha. This low value may be associated with the variable water table in peatlands. In areas that are quite wet or have a high water table, lichen may not be able to establish and persist.
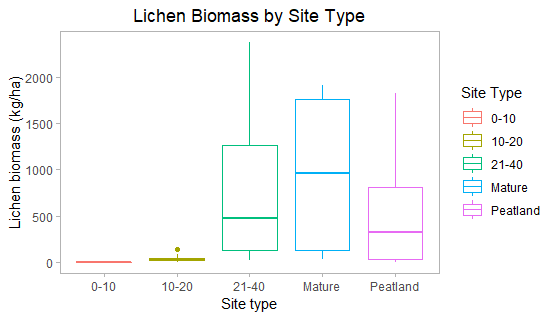
Figure 7. Total lichen biomass by site type. Little lichen is present less than 20 years post-fire, but biomass increases rapidly 20-40 years post-fire. Lichen increases in mature forests, but at a declining rate. Peatlands show low overall biomass, at less than half the biomass of upland forests at 20-40 years post-fire.
Analysis of Variance
Due to an abundance of zeros in my data and a high degree of skew, the assumption of normality was not met. To address this, a permutational analysis of variance was carried out to determine the effect of ecosite type and stand age on lichen biomass in upland sites. Ecosite type was found to have a significant effect on lichen biomass (p<0.001), and biomass was significantly affected by stand age (p<0.001) (Table 3). Based on the sum of squares for both ecosite type and stand age, stand age is three times more important in predicting lichen biomass (Table 3).
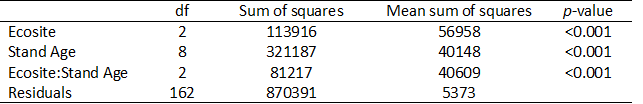
Table 3. Permutational ANOVA table. Both ecosite and stand age have a significant effect on lichen biomass (p<0.001, p<0.001 respectively).
Based on the results of the permuational ANOVA, multiple pairwise comparisons were done to determine which stand ages were significantly different from each other (Table 4). For clarity, stand ages were renamed Early (0-10 years post-fire), Mid (10-20 years post-fire), Late (21-40 years post-fire), and Mature forest. Nearly all ages showed significant differences (p<0.001), however there was no significant difference between lichen biomass in Early and Mid-age forests(p=0.995). Additionally, there was no significant difference between lichen biomass in Late and Mature forests (p=0.859), suggesting that lichen biomass has recovered approximately 40 years after a fire.
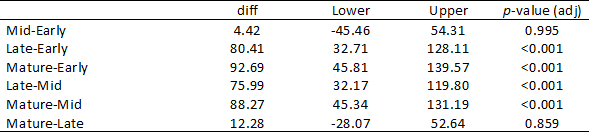
Table 4. Multiple pairwise comparisons for stand age. No significant difference was found between early and mid stage forests, or between late stage and mature forest.
Linear Regression
In order to determine the relationship between lichen cover and lichen biomass for both peatland and upland sites, a basic linear regression was carried out. Peatland sites show a strong linear, positive correlation (R²=0.941) between lichen cover and lichen biomass. Similarly, upland sites also show a linear relationship. Although there is more variability between these sites, there is still a strong positive correlation between lichen cover and biomass (R²=0.954). The linear equations derived from these regressions will allow me to predict lichen biomass at sites that were not harvested.
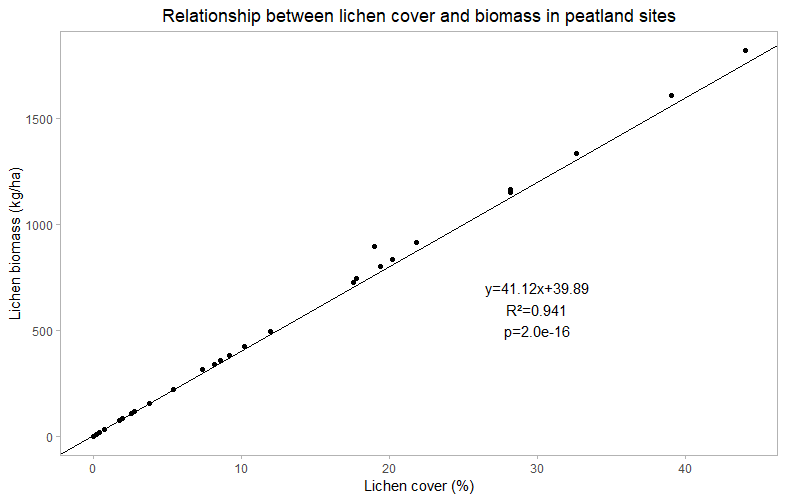
Figure 8. Relationship between cover and biomass in peatland sites. A linear relationship between lichen cover and biomass suggests that an increase in lichen cover will result in an increase in lichen biomass.
|
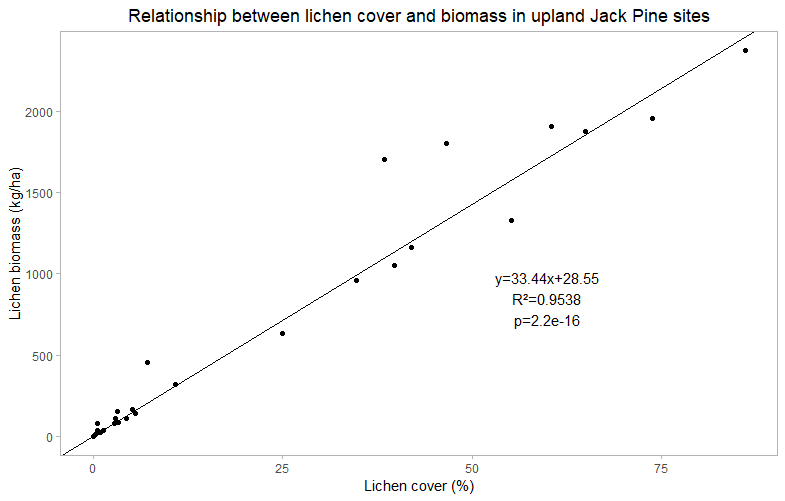
Figure 9. Relationship between cover and biomass in upland sites. A linear relationship between lichen cover and biomass suggests that an increase in lichen cover will result in an increase in lichen biomass.
|
Generalized Linear Mixed-effect Models
In order to determine which environmental variables were the best predictors of lichen biomass in upland sites, I ran a series of generalized linear mixed-effect models. Stand age and ecosite were retained in each model as fixed effects, and plot was included as a random effect. Akaike Information Criterion (AIC) values were used to determine the model of best fit. After ranking the models by AIC value, we found that for upland sites, vegetation cover and litter cover were the best predictors of lichen biomass (Table 5).

Table 5. Generalized linear mixed-effects model results for upland sites. After comparing ranked AIC values, the model of best fit shows that vegetation cover and litter cover are the best predictors of lichen biomass.
Linear mixed-effects models were also applied to peatland sites, retaining ecosite as a fixed effect and plot as a random effect. After comparing ranked AIC values, we found that tree canopy closure and the cover of sphagnum mosses were the best predictors of lichen biomass in peatland habitats (Table 6).

Table 6. Generalized linear mixed-effect model results for peatland sites. After comparing ranked AIC values, canopy closure and cover of sphagnum moss were found the be the best predictors of lichen biomass.
Discussion
My analyses support my prediction that lichen biomass would be low after a recent fire, but would increase over time at a decreasing rate. However, I didn't expect the high increase in lichen biomass between 10-20 years post-fire and 21-40 years post-fire. I found no significant difference in lichen biomass between 21-40 year old stands and mature stands, suggesting that lichen has recovered on the landscape at approximately 40 years post-fire. This supports previous research that suggests stands younger than 40 years post-fire are unsuitable for caribou habitat (Environment Canada, 2012). Future management strategies may look at reducing or eliminating development in these stands, as they provide a critical forage resource for struggling caribou populations. Fire management strategies may also want to focus on protecting these areas from burning, as they will take another 40 years to be able to sustain struggling caribou populations.
My analysis of total lichen biomass in peatland habitats did not support my prediction that lichen would be quite abundant in these complexes. Given that caribou are heavily utilizing peatlands, I would have expected overall biomass to be equivalent to or greater than total biomass in mature upland jack pine stands. Low total biomass suggests that caribou are not using peatlands as primary forage habitat, but may be using them more for predator avoidance, calving, and movement between upland stands. The disparity between the amount of time caribou spend in peatland habitats and the amount of lichen biomass in those habitats suggests that caribou need large expanses of land in order to meet their forage requirements. Future land use planning may want to look at including large peatland complexes and their associated upland habitats in development restrictions, protected areas planning, or in defining what is critical habitat for woodland caribou.
The next steps in my project will look at applying the generalized linear mixed-effect model outcomes, as well as the allometric equations derived from linear regression, at the landscape scale. Using remote sensing techniques, such as applying LiDAR data, land cover data, and lichen cover data to high resolution satellite imagery, I aim to map areas of suitable forage habitat within caribou ranges in my study area. This map will serve as a tool for land management, fire management, and protected areas planning to conserve areas of high value to struggling caribou populations in Alberta's boreal forest.
