|
Overview of data
|
Upland jack pine stands and peatlands were represented by our sampling units, which were plots. These plots consisted of a transect, which was divided into 5 quadrats. The predictor variable is Strata, which is represented by peatland, or stand age for upland sites. Strata was manipulated by surveying stands with varying times since fire, with an emphasis on selecting sites that were less than 10 years post-fire, 10-20 years post-fire, 21-40 years post-fire, and >40 years post-fire (mature forest). Our second predictor variable is ecosite, which was not manipulated. Our response variable is lichen cover, which is measured as percent cover for each reindeer lichen species.
Below is an example of how quadrat-level data is organized (Table 1).
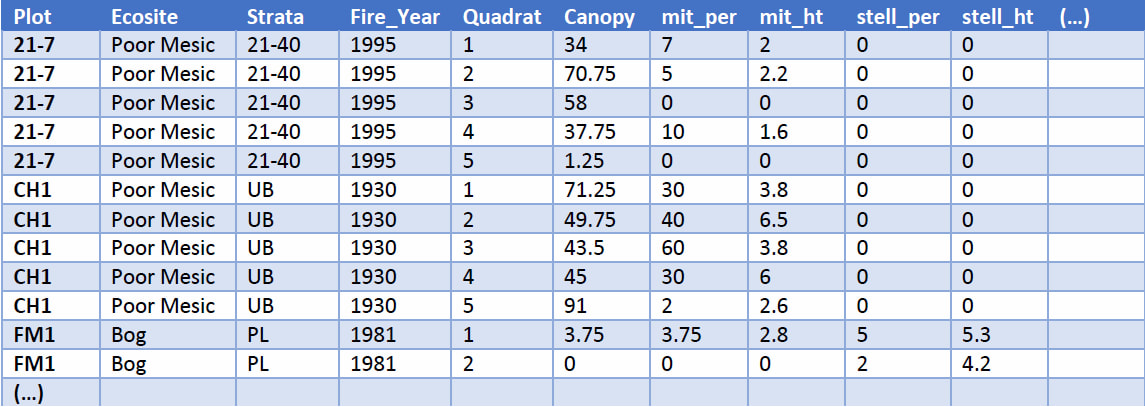
Table 1. Example of quadrat-level data. Included information consists of site name (Plot), ecosite type of the site (Ecosite), and the strata of the site (Strata; 21-40 = 21-40 years post-fire, UB=unburned or mature forest, PL=peatland). The year of the most recent fire is included (Fire_Year), as well as the quadrat number (Quadrat), and the canopy cover above the quadrat (Canopy). Lichen data is presented as percent cover of Cladonia arbusucla ssp. mitis (mit_per), height of C. arbuscula ssp. mitis (mit_ht), percent cover of C. stellaris (stell_per), and height of C. stellaris (stell_h). The larger dataset also contains measurements for cover and height of C. uncialis, C. stygia, C. amaurocrea, and C. rangerifina, as well as cover measurements for other lichens, downed woody material, litter, sphagnum, other moss, bare ground, animal, water, and vascular plants.
Quadrat-level data was summarized to represent each transect. Strata and Ecosite are the predictor variables. The response variables are canopy, lichen cover, and lichen kg/ha. Canopy represents average canopy closure for the 5 quadrats in each transect. Lichen_cover shows the mean percent cover of the 5 quadrats. Lichen_mass shows the sum of all measured biomass (g/m²) for each quadrat, which is then converted into kg/ha.
An example of transect-level data is presented below (Table 2). Each row represents one transect.
An example of transect-level data is presented below (Table 2). Each row represents one transect.

Table 2. Example of transect-level data. Included information consists of site name (Site), ecosite type (Ecosite), strata type of the site (Strata), the year of the most recent fire (Fire_Year), mean canopy cover among plots (Canopy), mean lichen cover among plots (Lichen_cover), total lichen biomass of all plots at site in g/m² (Lichen_mass), and lichen biomass in kg/ha for the site (Lichen_kg_ha).
Exploratory graphics
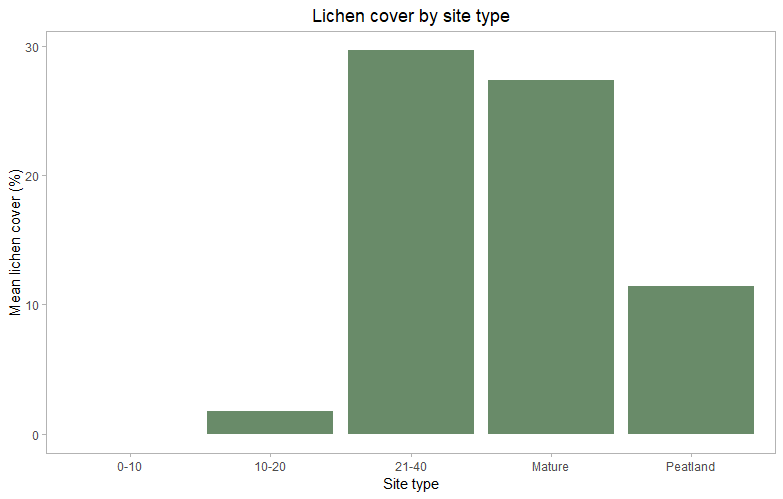
I looked at lichen cover for each strata using quadrat-level data. The spread of the data is quite high, with 21-40 years post-fire, mature forests, and peatlands showing a high degree of variation and skew. However, a trend is visible, with lichen cover increasing rapidly after 20 years post-fire but then remaining at about the same cover in stands >40 years post-fire. Peatland quadrats show the highest degree of spread, and contain many outliers, but show a lower percent cover than upland sites >20 years post-fire.

Figure 6. Boxplot of lichen cover by site type. Although the data show a high degree of variance and skew, a trend is visible. Lichen cover increases rapidly between 20 and 40 years post-fire, but then increases much more slowly after 40 years post-fire. Peatland quadrats show low overall lichen cover.
I plotted lichen biomass as a function of lichen cover, using quadrat-level data. For each site type, a positive linear relationship is observed between lichen cover and lichen biomass. Outliers were identified and further investigated, although all appear to be actual values based on variation between sites. Outliers were retained for further analysis.
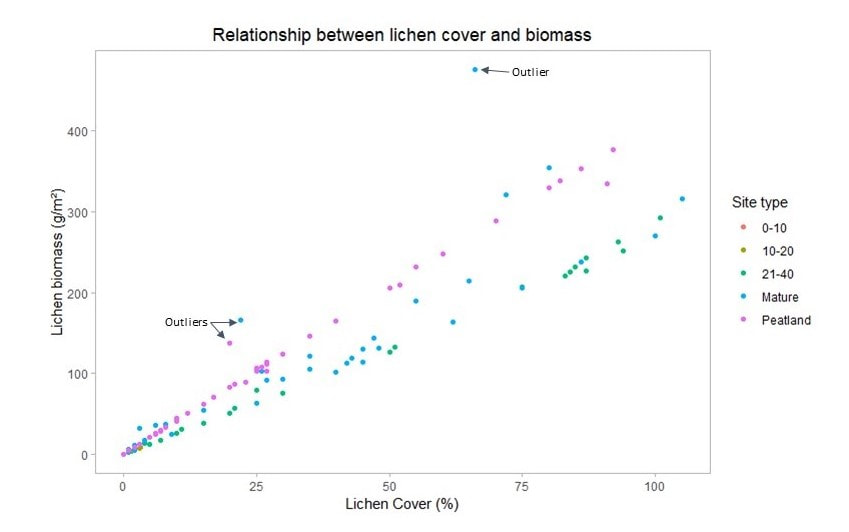
Figure 7. Scatterplot of the relationship between lichen cover and lichen biomass at the quadrat level. A positive linear relationship is observed between lichen cover and biomass for each of the site types. Site types listed are 0-10 years post-fire, 10-20 years post-fire, 21-40 years post-fire, mature forest (>40 years post-fire), and peatland. Identified outliers represent actual values, and have been retained in the dataset for further analysis.
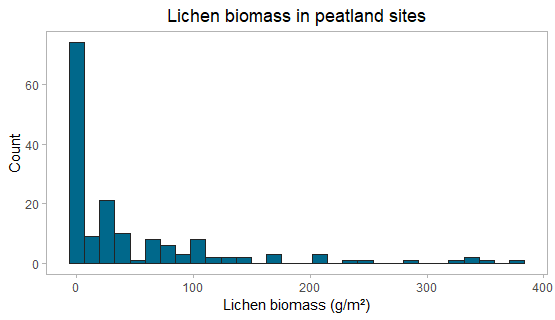
Below are histograms showing lichen biomass (g/m²) in peatland and upland sites. Due to the prevalence of quadrats with no lichen present, the data is not normally distributed and is skewed around zero.
|

|
Figure 8. Histograms for quadrat-level lichen biomass. Both peatlands and upland sites show a non-normal distribution, with data being highly skewed around zero.
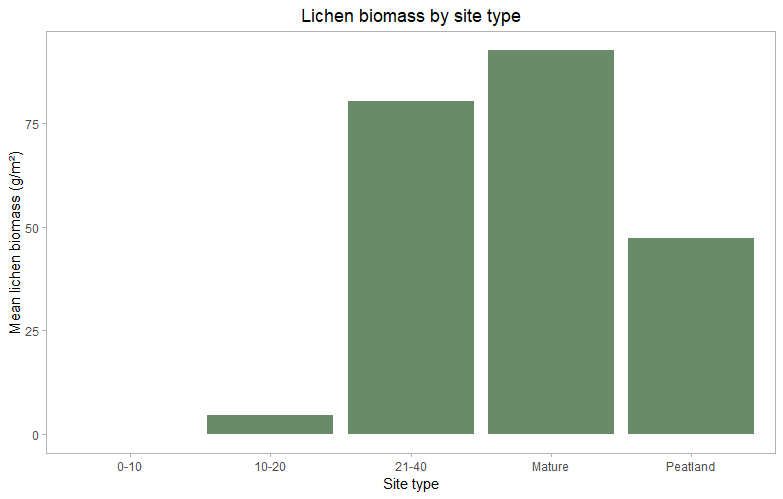
Using quadrat-level data, I calculated the mean lichen cover and biomass for each site type to observe overall trends in the data. Both cover and biomass increase rapidly between 20 and 40 years post-fire, but increase more slowly after 40 years. Peatland sites show low overall cover and biomass in comparison to mature upland sites.
|
|
Figure 9. Boxplots of mean lichen cover and mean lichen biomass for each site type. Both cover and biomass increase rapidly between 20 and 40 years post-fire. Peatland sites show lower cover and biomass than mature upland sites.
